
Downloads · 30 days
0
stivenmosheyoff/BankChurners
BankChurners is a machine learning model from stivenmosheyoff. Use it for the machine learning task on the model card, and read the license before you ship it in a product. The card lists the license as mit.
<video controls width="640" <source src="https://huggingface.co/stivenmosheyoff/BankChurners/resolve/main/video.mp4" type="video/mp4" Your browser does not support the video tag. </video
Downloads · 30 days
0
Access
Public
Updated Dec 11, 2025
Repo size
98.1 MB
Likes
0
Public
Click a slice to open those files.
.pkl57.7 MB · 56%
From the Hugging Face model README
Author: stiven rodriguez Course: Introduction to Data Science Assignment: Classification, Regression, Clustering, Evaluation Dataset Source: Kaggle – Predicting Credit Card Customer Segmentation Dataset Size: ~10,128 rows × 22 column
The objective of this project is to analyze credit card usage patterns to predict and classify customer spending levels (Low, Medium, or High) . By combining unsupervised clustering for customer profiling with advanced supervised learning models (like Gradient Boosting) , the solution enables the bank to implement precise, data-driven marketing and retention strategies.
The final dataset is the result of systematic cleaning, validation, and filtering procedures
Visualization: Correlation Heatmap of Variables
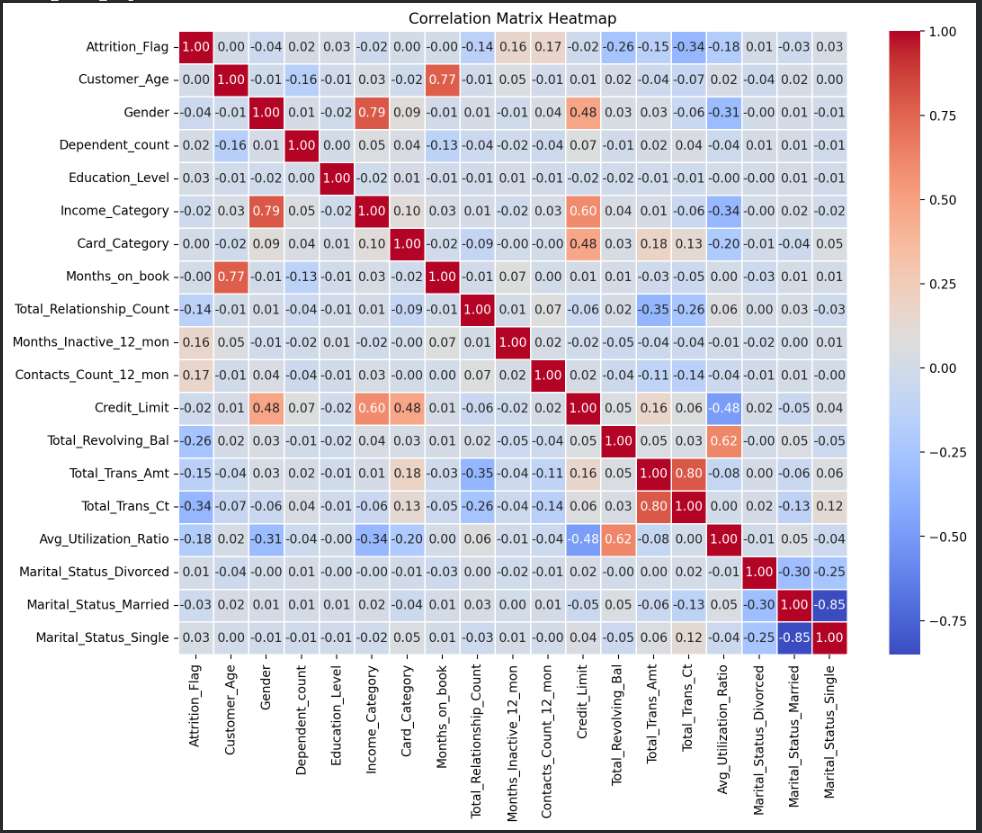 Click on the image above to view it in full size
Insight:
Visualization: bar plot
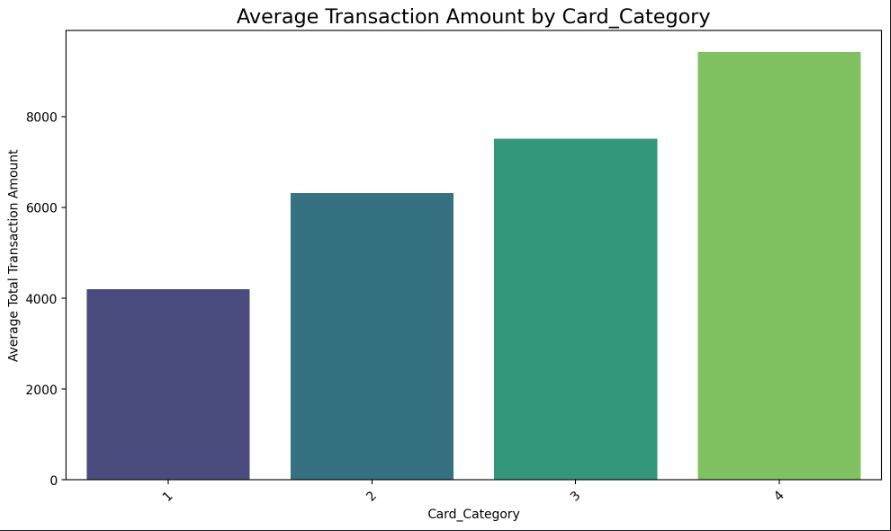 Click on the image above to view it in full size
Insight:
Visualization: bar plot
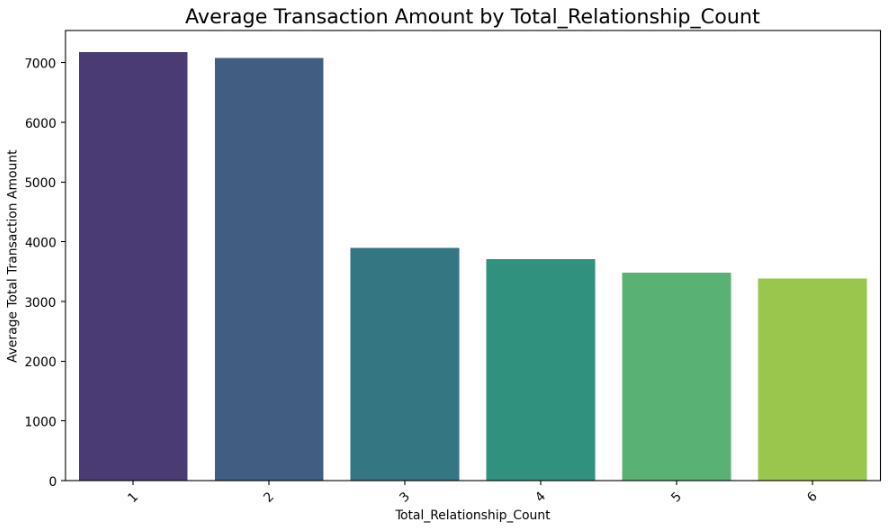 Click on the image above to view it in full size
Insight:
Main Research Question: Why Do Some Customers Spend More? Answer: The analysis clearly shows how different customer features are related to Total Transaction Amount (Total_Trans_Amt). By examining correlations and comparing average spending across key variables, we identify several consistent patterns that explain what drives higher or lower transaction amounts among customers. These findings support better customer segmentation and help highlight the factors most strongly associated with spending behavior.
Key Findings
Transaction Activity Drives Spending Total_Trans_Ct is the strongest predictor of Total_Trans_Amt, showing a strong positive correlation. Customers who complete more transactions also spend significantly more.
Card Tier Influences Transaction Amount Higher Card_Category levels are associated with higher average transaction amounts. Premium cardholders tend to be more active and spend more overall.
Utilization Ratio Reflects Customer Activity Avg_Utilization_Ratio has a moderate positive correlation with spending. Customers who use a larger portion of their credit limit tend to perform more—or larger—transactions.
Customer Age and Demographics Have Minimal Impact Variables such as age, gender, and marital status show near-zero correlation with spending. These demographic attributes do not meaningfully influence transaction behavior.
Relationship Depth Shows a Reverse Pattern Customers with fewer products (e.g., 1–2 relationships) have higher average transaction amounts. As Total_Relationship_Count increases, spending decreases—indicating a negative relationship. This may reflect that highly engaged customers distribute their financial activity across more products (e.g., savings, loans), reducing their card spending.
Secondary Correlations Weak positive correlations with Credit_Limit and Card_Category, and a negative correlation with Total_Relationship_Count, reinforce earlier behavioral insights.
Overall Insights
High spenders are not necessarily highly engaged customers. Customers with fewer bank products tend to concentrate their financial activity in card transactions, resulting in higher spending.
Premium cardholders represent a valuable segment. They show consistently higher spending and may serve as ideal targets for personalized offers or loyalty programs.
Transaction frequency is a key behavioral indicator. It explains more variance in spending than any demographic attribute or credit limit measure.
Utilization patterns signal financial activity intensity. Customers with higher utilization ratios may be more responsive to credit limit adjustments or risk assessments.
Segmentation Opportunities: The patterns identified can help define customer groups such as high-spending low-engagement customers, active premium users, or low-risk but low-activity customers.
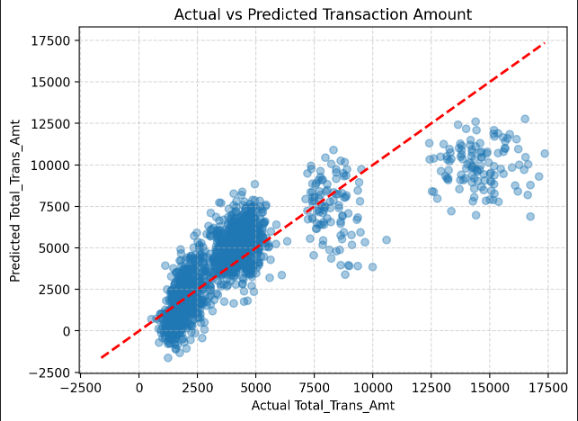 Click on the image above to view it in full size
A scatter plot of actual vs. predicted transaction amounts shows that:The model captures the general trend well. Prediction errors increase at higher spending levels.
This behavior is expected from a simple linear model when the underlying relationships may be partially non-linear.
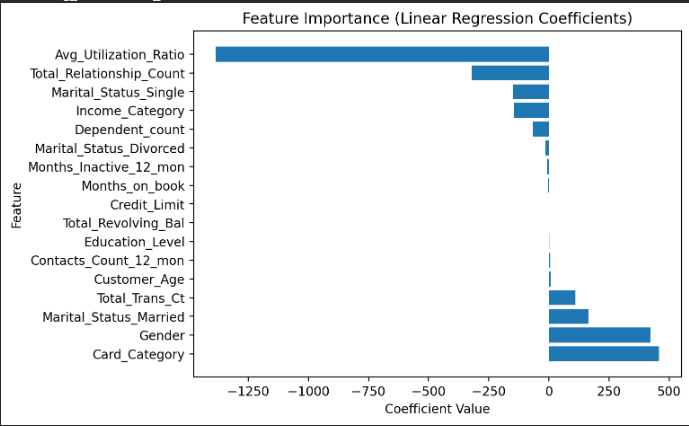 Click on the image above to view it in full size
The model performs moderately well for a first attempt, achieving an R² of 0.68. Transaction frequency (Total_Trans_Ct) is one of the strongest predictors of spending. Certain behavioral and demographic features also play an important role, while others have minimal impact. This baseline establishes a solid foundation for future model improvements such as polynomial features, regularization, or tree-based models.
This section focuses on creating new informative features through scaling, transformation, and clustering, as required in the assignment.
Selected behavioral and financial variables (Total_Trans_Ct, Total_Revolving_Bal, Avg_Utilization_Ratio, Total_Relationship_Count, Credit_Limit) were standardized using StandardScaler, as required for clustering algorithms.
A K-Means model with 4 clusters was trained on the scaled features. Two new features were created as required: Cluster_ID — the cluster assignment for each customer Dist_To_Centroid — distance from each sample to its closest cluster center (measures typicality) Cluster_ID was then one-hot encoded, making the clustering results usable in downstream supervised models.
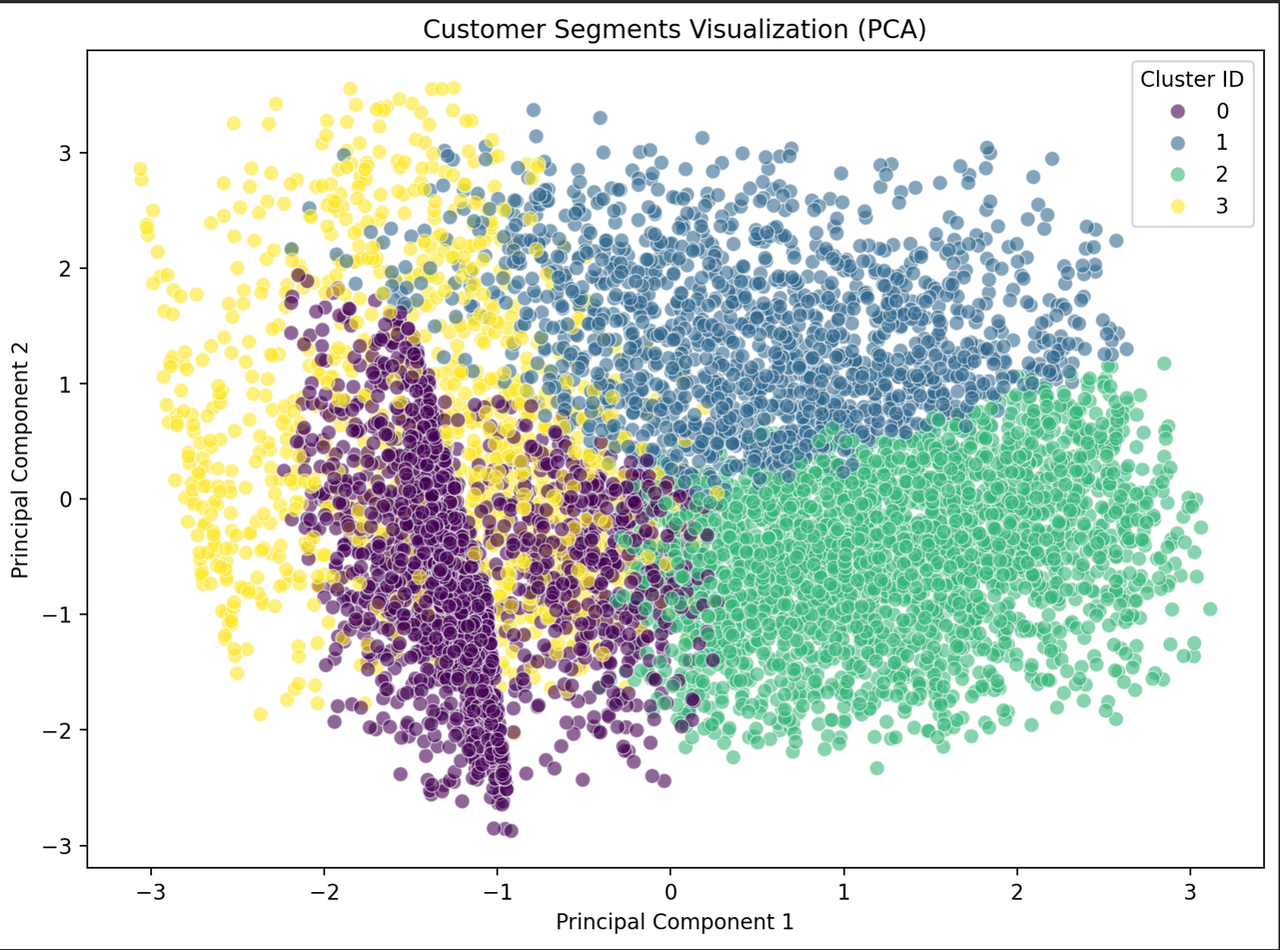 PCA was applied to reduce the scaled feature space to 2 components, enabling a clear visualization of the four customer segments and validating the clustering structure.
Cluster Interpretation Cluster-level mean statistics were computed to profile each customer segment and understand behavioral differences relevant to transaction patterns.
Outcome All required elements of Part 4 were completed: scaling, feature creation, categorical encoding, clustering-based feature engineering, PCA visualization, and segment interpretation.
The baseline Linear Regression model was retrained using the full engineered dataset, which includes:
cluster features (Cluster_*, Dist_To_Centroid)
scaled numerical variables
encoded categorical features
This provides a fair, improved benchmark for comparison.
Two non-linear models were trained on the same engineered dataset:
Random Forest Regressor
Gradient Boosting Regressor
Both models come from the sklearn library, satisfying the requirement for multiple model types.
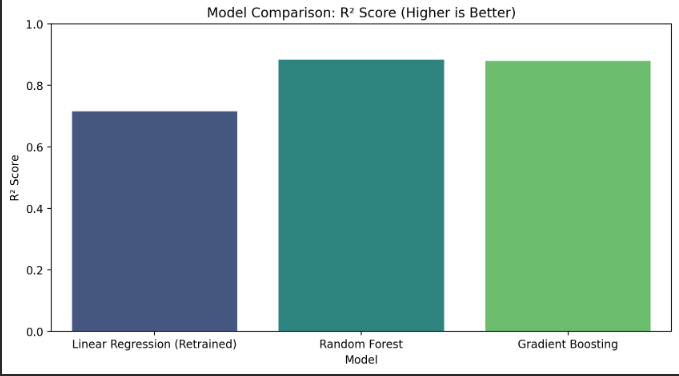 Each model was evaluated using:
MAE, RMSE, R²
The results clearly show improvement over the baseline and over the retrained Linear Regression model. A bar plot visualized the R² values of all models for easy comparison.
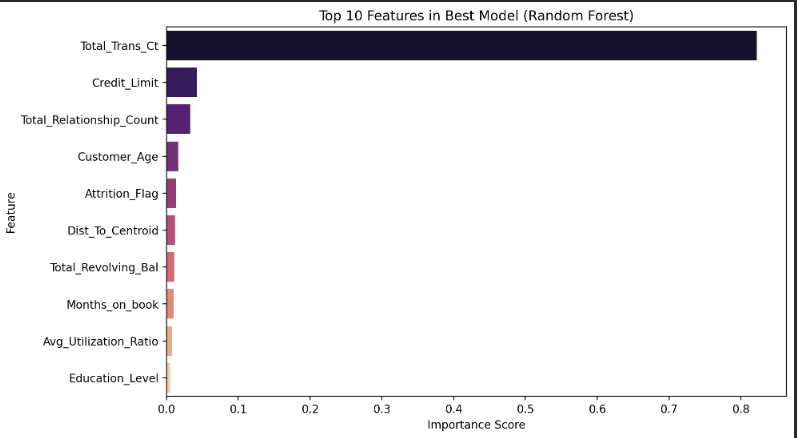 For the best-performing model (Random Forest), the top 10 most important features were plotted using feature_importances_.
Key drivers include:
Total_Trans_Ct, Credit_Limit, Total_Relationship_Count ,Dist_To_Centroid
This demonstrates how the engineered features impact the final prediction.
Model performance improved significantly (+27% vs. baseline). Tree-based models perform better because they:
capture non-linear relationships
learn interactions between variables
leverage the cluster-based features more effectively
The best model based on R² performance:
🏆 Random Forest Regressor (R² ≈ 0.838)
In this step, the original continuous target variable (Total_Trans_Amt) was transformed into discrete categories to reframe the regression problem as a classification task. A quantile-based binning strategy (q=3) was applied, creating three balanced classes:
Class 0 – Low spenders (bottom 33%)
Class 1 – Medium spenders (middle 33%)
Class 2 – High spenders (top 33%)
This approach ensures evenly distributed classes and provides meaningful business segmentation (e.g., retention for low spenders, upselling for medium, and VIP targeting for high spenders). The same engineered features from previous sections were used, and the dataset was properly split into train and test sets without data leakage.
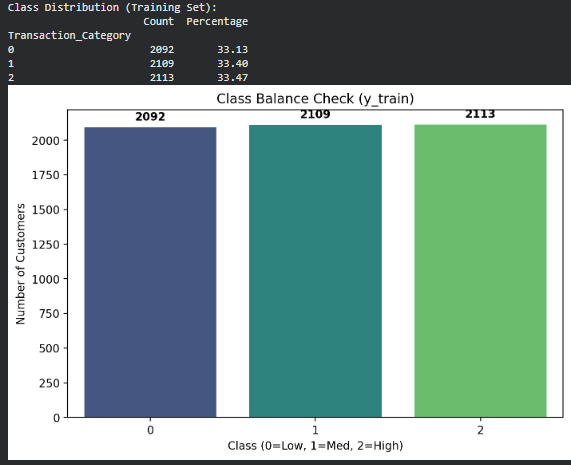
Class 0 = 2,092 (33.13%) Class 1 = 2,109 (33.40%) Class 2 = 2,113 (33.47%)
This indicates equal-sized groups created by the qcut method.
2️ Are some classes under-represented? No. All three classes have almost identical proportions (~33% each). Therefore, the dataset is well balanced.
3️ If the data is imbalanced, explain which metric you’ll focus on and why accuracy alone is misleading. Since the classes are balanced, using Accuracy as the main evaluation metric is appropriate. (Theory explanation included:) Accuracy becomes misleading only when one class dominates. For example, if 90% of customers were Class 0, a model guessing only Class 0 could score 90% accuracy
while completely failing to detect the other classes. In such cases, F1-score or Recall would be preferred.
Precision vs Recall In this customer segmentation task, recall for the High spending class is more important than precision. Missing a true high-value customer means failing to offer them VIP benefits or retention incentives, increasing the risk of churn. It is less harmful to mistakenly classify a Medium customer as High than to overlook a true High spender.
False Positives vs False Negatives A False Negative (a true High spender predicted as Medium/Low) is more critical than a False Positive. A False Negative may cause the company to ignore a valuable customer segment, while a False Positive only results in minor overspending on marketing. Therefore, minimizing False Negatives is a priority.
Three different classification models were trained on the engineered feature set: Logistic Regression (linear model) Random Forest Classifier (bagging, tree-based) Gradient Boosting Classifier (boosting, tree-based)
Each model was evaluated using Accuracy and Weighted F1-Score.
Results show that tree-based methods outperform the linear baselin
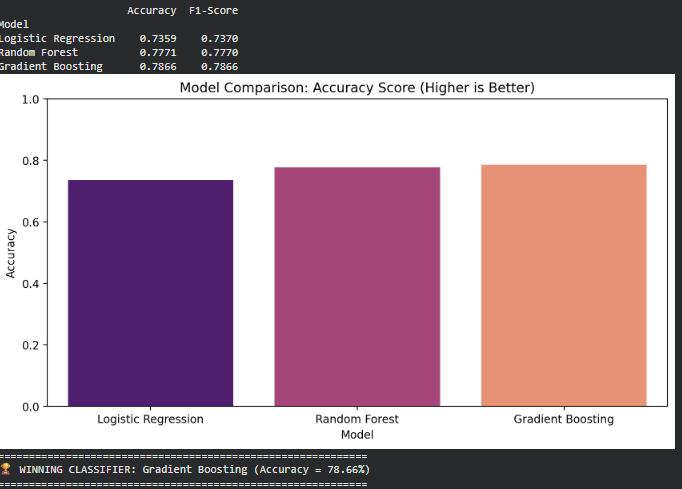
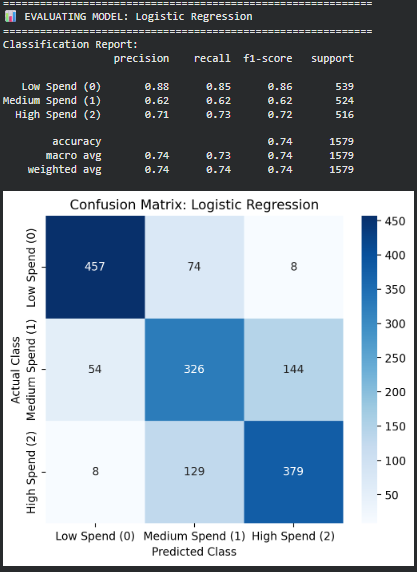
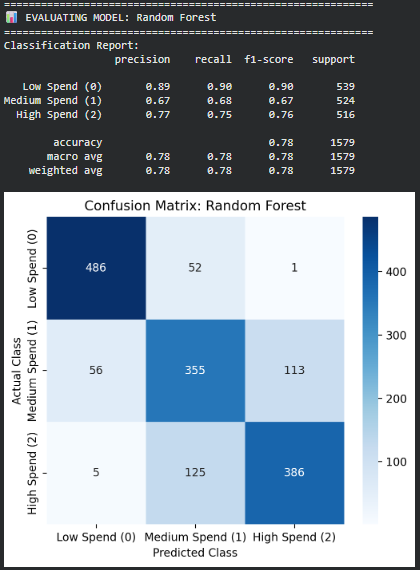
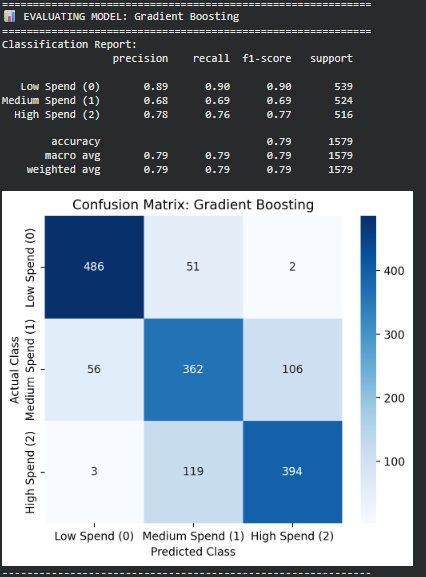
Gradient Boosting achieved the highest Accuracy and F1-score, and produced the most stable class predictions. It made the fewest critical mistakes — especially avoiding False Negatives for High spenders, which is key from a business perspective. Its ability to capture complex, non-linear relationships makes it the superior model for this classification task.