
Downloads · 30 days
0
0% of all-time downloads
ibm-nasa-geospatial/Prithvi-EO-1.0-100M-sen1floods11
Prithvi-EO-1.0-100M-sen1floods11 is a image segmentation model from ibm-nasa-geospatial. Use it for the image segmentation task on the model card, and read the license before you ship it in a product. It is set up for terratorch. The card lists the license as apache-2.0.
The pretrained Prithvi-EO-1.0-100m model is finetuned to segment the extent of floods on Sentinel-2 images from the Sen1Floods11 dataset.
Downloads · 30 days
0
0% of all-time downloads
All-time downloads
52
Public
Repo size
2.4 GB
Likes
58
Public
Click a slice to open those files.
.pth1.2 GB · 100%
From the Hugging Face model README
The pretrained Prithvi-EO-1.0-100m model is finetuned to segment the extent of floods on Sentinel-2 images from the Sen1Floods11 dataset.
The dataset consists of 446 labeled 512x512 chips that span all 14 biomes, 357 ecoregions, and 6 continents of the world across 11 flood events. The benchmark associated to Sen1Floods11 provides results for fully convolutional neural networks trained in various input/labeled data setups, considering Sentinel-1 and Sentinel-2 imagery.
We extract the following bands for flood mapping:
Labels represent no water (class 0), water/flood (class 1), and no data/clouds (class -1).
The Prithvi-100m model was initially pretrained using a sequence length of 3 timesteps. Based on the characteristics of this benchmark dataset, we focus on single-timestamp segmentation. This demonstrates that our model can be utilized with an arbitrary number of timestamps during finetuning.
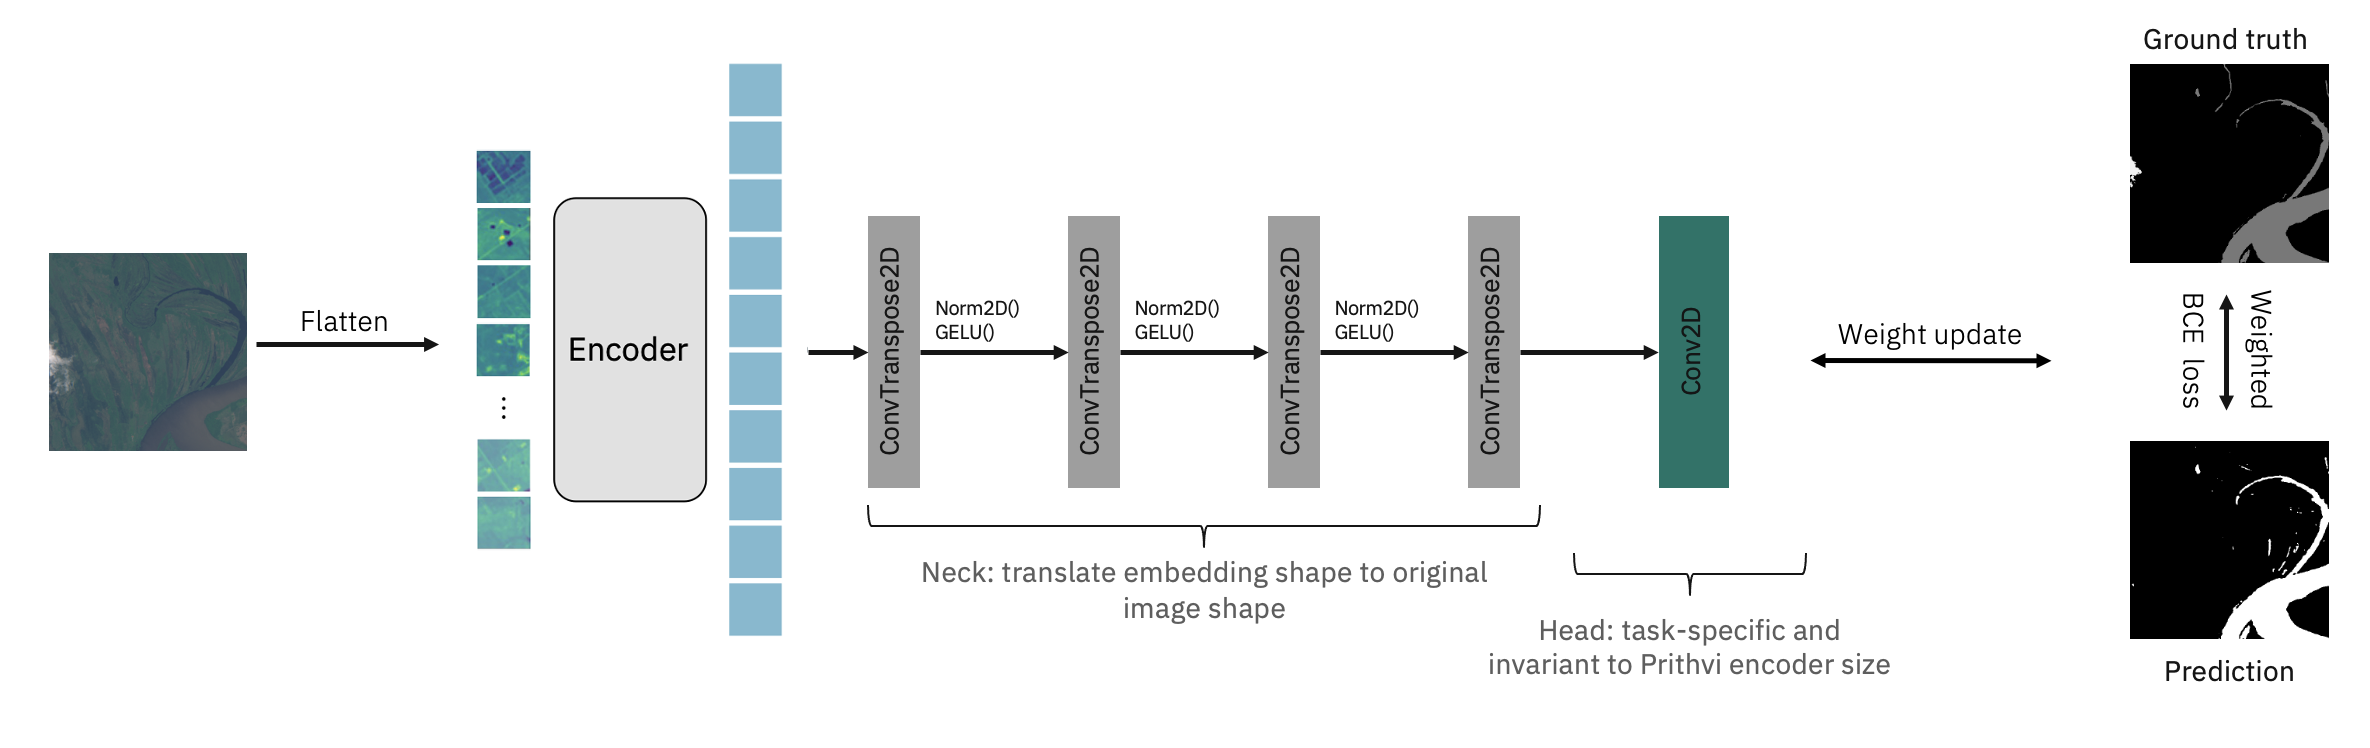
The code for this finetuning is available through github.
The configuration used for finetuning is available through this config.
Finetuning the geospatial foundation model for 100 epochs leads to the following performance on the test dataset:
| Classes | IoU | Acc |
|---|---|---|
| No water | 96.90% | 98.11% |
| Water/Flood | 80.46% | 90.54% |
| aAcc | mIoU | mAcc |
|---|---|---|
| 97.25% | 88.68% | 94.37% |
The performance of the model has been further validated on an unseen, holdout flood event in Bolivia. The results are consistent with the performance on the test set:
| Classes | IoU | Acc |
|---|---|---|
| No water | 95.37% | 97.39% |
| Water/Flood | 77.95% | 88.74% |
| aAcc | mIoU | mAcc |
|---|---|---|
| 96.02% | 86.66% | 93.07% |
Finetuning took ~1 hour on an NVIDIA V100.
The github repo includes an inference script that allows running the flood mapping model for inference on Sentinel-2 images. These inputs have to be geotiff format, including 6 bands for a single time-step described above (Blue, Green, Red, Narrow NIR, SWIR, SWIR 2) in order. There is also a demo that leverages the same code here.
Your feedback is invaluable to us. If you have any feedback about the model, please feel free to share it with us. You can do this by submitting issues on our open-source repository, hls-foundation-os, on GitHub.
If this model helped your research, please cite our model in your publications. Here is an example BibTeX entry:
@misc{Prithvi-100M-flood-mapping,
    author          = {Jakubik, Johannes and Fraccaro, Paolo and Oliveira Borges, Dario and Muszynski, Michal and Weldemariam, Kommy and Zadrozny, Bianca and Ganti, Raghu and Mukkavilli, Karthik},
    month           = aug,
    doi             = { 10.57967/hf/0973 },
    title           = {{Prithvi 100M flood mapping}},
    repository-code = {https://huggingface.co/ibm-nasa-geospatial/Prithvi-100M-sen1floods11},
    year            = {2023}
}