Downloads · 30 days
0
BenjaminB/example-california-housing
example-california-housing is a tabular regression model from BenjaminB. Use it for the tabular regression task on the model card, and read the license before you ship it in a product. It is set up for sklearn.
Gradient boosting regressor trained on California Housing dataset
Downloads · 30 days
0
Access
Public
Updated Feb 28, 2023
Repo size
29.3 MB
Likes
0
Public
Click a slice to open those files.
.skops14.7 MB · 99%
From the Hugging Face model README
Gradient boosting regressor trained on California Housing dataset
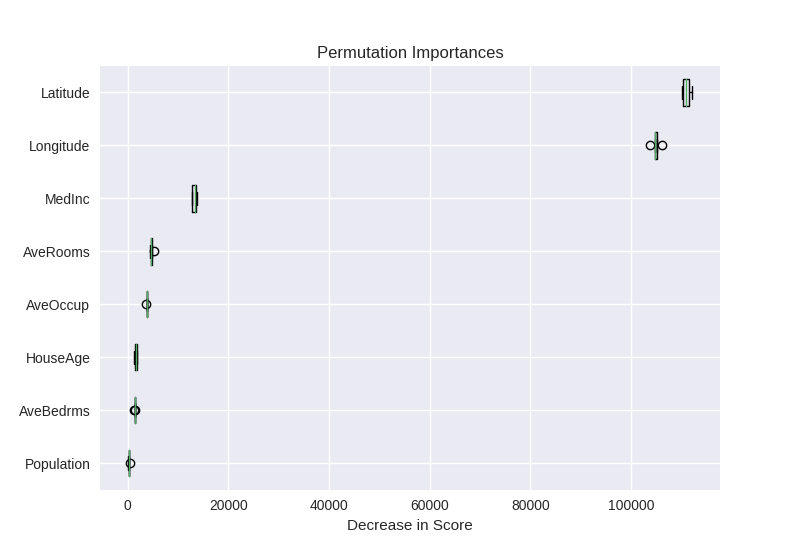
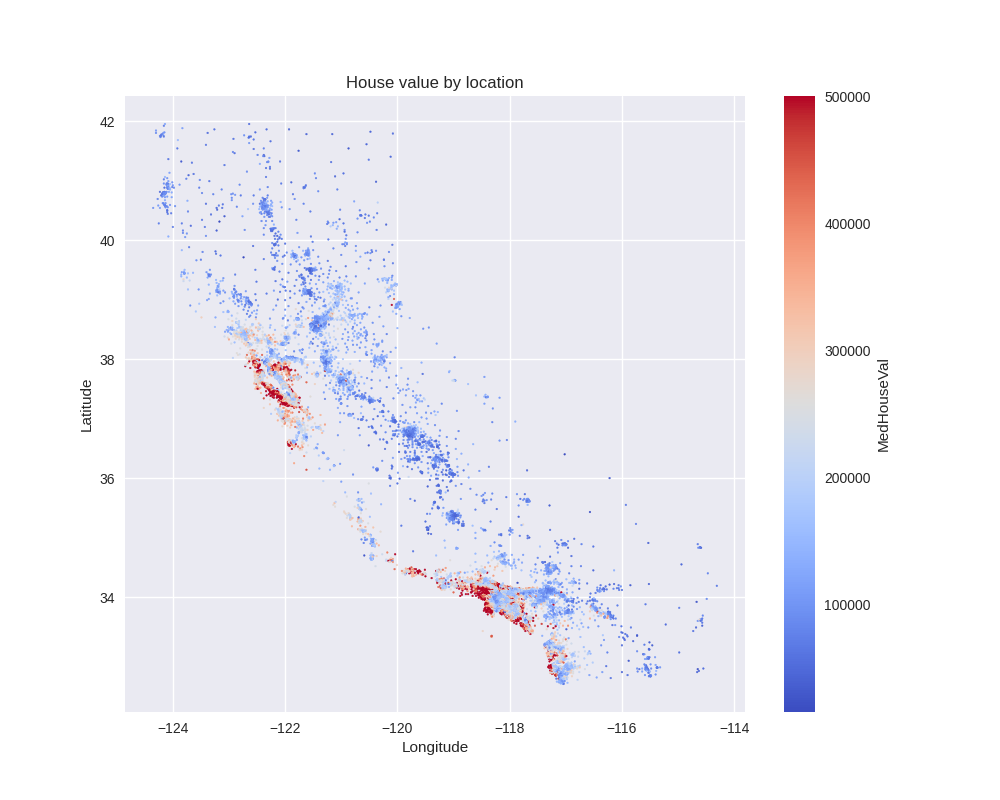
The model is a gradient boosting regressor from sklearn. On top of the standard features, it contains predictions from a KNN models. These predictions are calculated out of fold, then added on top of the existing features. These features are really helpful for decision tree-based models, since those cannot easily learn from geospatial data.
This model is meant for demonstration purposes
The model is trained with below hyperparameters.
<details> <summary> Click to expand </summary>| Hyperparameter | Value |
|---|---|
| cv | |
| estimators | [('knn@5', Pipeline(steps=[('select_cols',<br /> ColumnTransformer(transformers=[('long_and_lat', 'passthrough',<br /> ['Longitude', 'Latitude'])])),<br /> ('knn', KNeighborsRegressor())]))] |
| final_estimator__alpha | 0.9 |
| final_estimator__ccp_alpha | 0.0 |
| final_estimator__criterion | friedman_mse |
| final_estimator__init | |
| final_estimator__learning_rate | 0.1 |
| final_estimator__loss | squared_error |
| final_estimator__max_depth | 3 |
| final_estimator__max_features | |
| final_estimator__max_leaf_nodes | |
| final_estimator__min_impurity_decrease | 0.0 |
| final_estimator__min_samples_leaf | 1 |
| final_estimator__min_samples_split | 2 |
| final_estimator__min_weight_fraction_leaf | 0.0 |
| final_estimator__n_estimators | 500 |
| final_estimator__n_iter_no_change | |
| final_estimator__random_state | 0 |
| final_estimator__subsample | 1.0 |
| final_estimator__tol | 0.0001 |
| final_estimator__validation_fraction | 0.1 |
| final_estimator__verbose | 0 |
| final_estimator__warm_start | False |
| final_estimator | GradientBoostingRegressor(n_estimators=500, random_state=0) |
| n_jobs | |
| passthrough | True |
| verbose | 0 |
| knn@5 | Pipeline(steps=[('select_cols',<br /> ColumnTransformer(transformers=[('long_and_lat', 'passthrough',<br /> ['Longitude', 'Latitude'])])),<br /> ('knn', KNeighborsRegressor())]) |
| knn@5__memory | |
| knn@5__steps | [('select_cols', ColumnTransformer(transformers=[('long_and_lat', 'passthrough',<br /> ['Longitude', 'Latitude'])])), ('knn', KNeighborsRegressor())] |
| knn@5__verbose | False |
| knn@5__select_cols | ColumnTransformer(transformers=[('long_and_lat', 'passthrough',<br /> ['Longitude', 'Latitude'])]) |
| knn@5__knn | KNeighborsRegressor() |
| knn@5__select_cols__n_jobs | |
| knn@5__select_cols__remainder | drop |
| knn@5__select_cols__sparse_threshold | 0.3 |
| knn@5__select_cols__transformer_weights | |
| knn@5__select_cols__transformers | [('long_and_lat', 'passthrough', ['Longitude', 'Latitude'])] |
| knn@5__select_cols__verbose | False |
| knn@5__select_cols__verbose_feature_names_out | True |
| knn@5__select_cols__long_and_lat | passthrough |
| knn@5__knn__algorithm | auto |
| knn@5__knn__leaf_size | 30 |
| knn@5__knn__metric | minkowski |
| knn@5__knn__metric_params | |
| knn@5__knn__n_jobs | |
| knn@5__knn__n_neighbors | 5 |
| knn@5__knn__p | 2 |
| knn@5__knn__weights | uniform |
The model plot is below.
<style>#sk-container-id-13 {color: black;background-color: white;}#sk-container-id-13 pre{padding: 0;}#sk-container-id-13 div.sk-toggleable {background-color: white;}#sk-container-id-13 label.sk-toggleable__label {cursor: pointer;display: block;width: 100%;margin-bottom: 0;padding: 0.3em;box-sizing: border-box;text-align: center;}#sk-container-id-13 label.sk-toggleable__label-arrow:before {content: "▸";float: left;margin-right: 0.25em;color: #696969;}#sk-container-id-13 label.sk-toggleable__label-arrow:hover:before {color: black;}#sk-container-id-13 div.sk-estimator:hover label.sk-toggleable__label-arrow:before {color: black;}#sk-container-id-13 div.sk-toggleable__content {max-height: 0;max-width: 0;overflow: hidden;text-align: left;background-color: #f0f8ff;}#sk-container-id-13 div.sk-toggleable__content pre {margin: 0.2em;color: black;border-radius: 0.25em;background-color: #f0f8ff;}#sk-container-id-13 input.sk-toggleable__control:checked~div.sk-toggleable__content {max-height: 200px;max-width: 100%;overflow: auto;}#sk-container-id-13 input.sk-toggleable__control:checked~label.sk-toggleable__label-arrow:before {content: "▾";}#sk-container-id-13 div.sk-estimator input.sk-toggleable__control:checked~label.sk-toggleable__label {background-color: #d4ebff;}#sk-container-id-13 div.sk-label input.sk-toggleable__control:checked~label.sk-toggleable__label {background-color: #d4ebff;}#sk-container-id-13 input.sk-hidden--visually {border: 0;clip: rect(1px 1px 1px 1px);clip: rect(1px, 1px, 1px, 1px);height: 1px;margin: -1px;overflow: hidden;padding: 0;position: absolute;width: 1px;}#sk-container-id-13 div.sk-estimator {font-family: monospace;background-color: #f0f8ff;border: 1px dotted black;border-radius: 0.25em;box-sizing: border-box;margin-bottom: 0.5em;}#sk-container-id-13 div.sk-estimator:hover {background-color: #d4ebff;}#sk-container-id-13 div.sk-parallel-item::after {content: "";width: 100%;border-bottom: 1px solid gray;flex-grow: 1;}#sk-container-id-13 div.sk-label:hover label.sk-toggleable__label {background-color: #d4ebff;}#sk-container-id-13 div.sk-serial::before {content: "";position: absolute;border-left: 1px solid gray;box-sizing: border-box;top: 0;bottom: 0;left: 50%;z-index: 0;}#sk-container-id-13 div.sk-serial {display: flex;flex-direction: column;align-items: center;background-color: white;padding-right: 0.2em;padding-left: 0.2em;position: relative;}#sk-container-id-13 div.sk-item {position: relative;z-index: 1;}#sk-container-id-13 div.sk-parallel {display: flex;align-items: stretch;justify-content: center;background-color: white;position: relative;}#sk-container-id-13 div.sk-item::before, #sk-container-id-13 div.sk-parallel-item::before {content: "";position: absolute;border-left: 1px solid gray;box-sizing: border-box;top: 0;bottom: 0;left: 50%;z-index: -1;}#sk-container-id-13 div.sk-parallel-item {display: flex;flex-direction: column;z-index: 1;position: relative;background-color: white;}#sk-container-id-13 div.sk-parallel-item:first-child::after {align-self: flex-end;width: 50%;}#sk-container-id-13 div.sk-parallel-item:last-child::after {align-self: flex-start;width: 50%;}#sk-container-id-13 div.sk-parallel-item:only-child::after {width: 0;}#sk-container-id-13 div.sk-dashed-wrapped {border: 1px dashed gray;margin: 0 0.4em 0.5em 0.4em;box-sizing: border-box;padding-bottom: 0.4em;background-color: white;}#sk-container-id-13 div.sk-label label {font-family: monospace;font-weight: bold;display: inline-block;line-height: 1.2em;}#sk-container-id-13 div.sk-label-container {text-align: center;}#sk-container-id-13 div.sk-container {/* jupyter's `normalize.less` sets `[hidden] { display: none; }` but bootstrap.min.css set `[hidden] { display: none !important; }` so we also need the `!important` here to be able to override the default hidden behavior on the sphinx rendered scikit-learn.org. See: https://github.com/scikit-learn/scikit-learn/issues/21755 */display: inline-block !important;position: relative;}#sk-container-id-13 div.sk-text-repr-fallback {display: none;}</style><div id="sk-container-id-13" class="sk-top-container" style="overflow: auto;"><div class="sk-text-repr-fallback"><pre>StackingRegressor(estimators=[('knn@5',Pipeline(steps=[('select_cols',ColumnTransformer(transformers=[('long_and_lat','passthrough',['Longitude','Latitude'])])),('knn',KNeighborsRegressor())]))],final_estimator=GradientBoostingRegressor(n_estimators=500,random_state=0),passthrough=True)</pre><b>In a Jupyter environment, please rerun this cell to show the HTML representation or trust the notebook. <br />On GitHub, the HTML representation is unable to render, please try loading this page with nbviewer.org.</b></div><div class="sk-container" hidden><div class="sk-item sk-dashed-wrapped"><div class="sk-label-container"><div class="sk-label sk-toggleable"><input class="sk-toggleable__control sk-hidden--visually" id="sk-estimator-id-41" type="checkbox" ><label for="sk-estimator-id-41" class="sk-toggleable__label sk-toggleable__label-arrow">StackingRegressor</label><div class="sk-toggleable__content"><pre>StackingRegressor(estimators=[('knn@5',Pipeline(steps=[('select_cols',ColumnTransformer(transformers=[('long_and_lat','passthrough',['Longitude','Latitude'])])),('knn',KNeighborsRegressor())]))],final_estimator=GradientBoostingRegressor(n_estimators=500,random_state=0),passthrough=True)</pre></div></div></div><div class="sk-serial"><div class="sk-item"><div class="sk-parallel"><div class="sk-parallel-item"><div class="sk-item"><div class="sk-label-container"><div class="sk-label sk-toggleable"><label>knn@5</label></div></div><div class="sk-serial"><div class="sk-item"><div class="sk-serial"><div class="sk-item sk-dashed-wrapped"><div class="sk-label-container"><div class="sk-label sk-toggleable"><input class="sk-toggleable__control sk-hidden--visually" id="sk-estimator-id-42" type="checkbox" ><label for="sk-estimator-id-42" class="sk-toggleable__label sk-toggleable__label-arrow">select_cols: ColumnTransformer</label><div class="sk-toggleable__content"><pre>ColumnTransformer(transformers=[('long_and_lat', 'passthrough',['Longitude', 'Latitude'])])</pre></div></div></div><div class="sk-parallel"><div class="sk-parallel-item"><div class="sk-item"><div class="sk-label-container"><div class="sk-label sk-toggleable"><input class="sk-toggleable__control sk-hidden--visually" id="sk-estimator-id-43" type="checkbox" ><label for="sk-estimator-id-43" class="sk-toggleable__label sk-toggleable__label-arrow">long_and_lat</label><div class="sk-toggleable__content"><pre>['Longitude', 'Latitude']</pre></div></div></div><div class="sk-serial"><div class="sk-item"><div class="sk-estimator sk-toggleable"><input class="sk-toggleable__control sk-hidden--visually" id="sk-estimator-id-44" type="checkbox" ><label for="sk-estimator-id-44" class="sk-toggleable__label sk-toggleable__label-arrow">passthrough</label><div class="sk-toggleable__content"><pre>passthrough</pre></div></div></div></div></div></div></div></div><div class="sk-item"><div class="sk-estimator sk-toggleable"><input class="sk-toggleable__control sk-hidden--visually" id="sk-estimator-id-45" type="checkbox" ><label for="sk-estimator-id-45" class="sk-toggleable__label sk-toggleable__label-arrow">KNeighborsRegressor</label><div class="sk-toggleable__content"><pre>KNeighborsRegressor()</pre></div></div></div></div></div></div></div></div></div></div><div class="sk-item"><div class="sk-parallel"><div class="sk-parallel-item"><div class="sk-item"><div class="sk-label-container"><div class="sk-label sk-toggleable"><label>final_estimator</label></div></div><div class="sk-serial"><div class="sk-item"><div class="sk-estimator sk-toggleable"><input class="sk-toggleable__control sk-hidden--visually" id="sk-estimator-id-46" type="checkbox" ><label for="sk-estimator-id-46" class="sk-toggleable__label sk-toggleable__label-arrow">GradientBoostingRegressor</label><div class="sk-toggleable__content"><pre>GradientBoostingRegressor(n_estimators=500, random_state=0)</pre></div></div></div></div></div></div></div></div></div></div></div></div>Metrics are calculated on the test set
| Metric | Value |
|---|---|
| Root mean squared error | 44273.5 |
| Mean absolute error | 30079.9 |
| R² | 0.805954 |
Data Set Characteristics:
:Number of Instances: 20640

:Number of Attributes: 8 numeric, predictive attributes and the target

:Attribute Information:
    - MedInc        median income in block group
    - HouseAge      median house age in block group
    - AveRooms      average number of rooms per household
    - AveBedrms     average number of bedrooms per household
    - Population    block group population
    - AveOccup      average number of household members
    - Latitude      block group latitude
    - Longitude     block group longitude

:Missing Attribute Values: None
This dataset was obtained from the StatLib repository. https://www.dcc.fc.up.pt/~ltorgo/Regression/cal_housing.html
The target variable is the median house value for California districts, expressed in hundreds of thousands of dollars ($100,000).
This dataset was derived from the 1990 U.S. census, using one row per census block group. A block group is the smallest geographical unit for which the U.S. Census Bureau publishes sample data (a block group typically has a population of 600 to 3,000 people).
An household is a group of people residing within a home. Since the average number of rooms and bedrooms in this dataset are provided per household, these columns may take surpinsingly large values for block groups with few households and many empty houses, such as vacation resorts.
It can be downloaded/loaded using the
:func:sklearn.datasets.fetch_california_housing function.
.. topic:: References
- Pace, R. Kelley and Ronald Barry, Sparse Spatial Autoregressions,
  Statistics and Probability Letters, 33 (1997) 291-297
Run the code below to load the model
import json
import pandas as pd
import skops.io as sio
model = sio.load("model.skops")
with open("config.json") as f:
    config = json.load(f)
model.predict(pd.DataFrame.from_dict(config["sklearn"]["example_input"]))
Benjamin Bossan